

Today’s Weather Outlook
Current NWS Warnings Watches and Advisories

Current Weather Map

Current Weather Radar

Severe Thunderstorm or Tornado Watches


Maximum Heat Index

Areas of Active Weather


Minimum Wind Chill

Current Observed Weather
Current Wind Gusts

Current Temperature

Current Visibility

Current Dew Point

Today
National Forecast

Severe Thunderstorms

Hail Probability

Wind Probability

Tornado Probability

Wind Gusts

Wildfire Risk

Flash Floods

Precipitation Amounts

Snowfall amounts

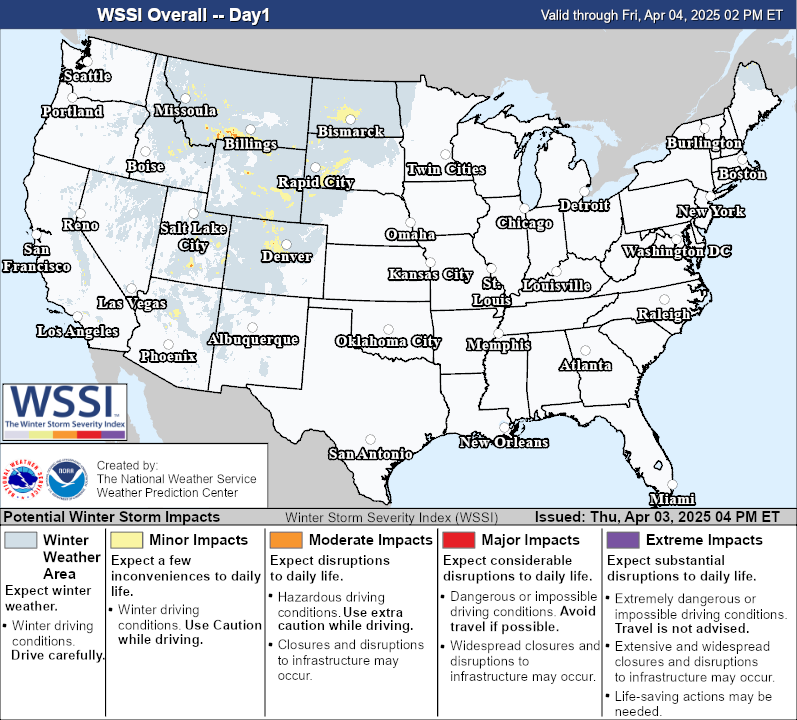
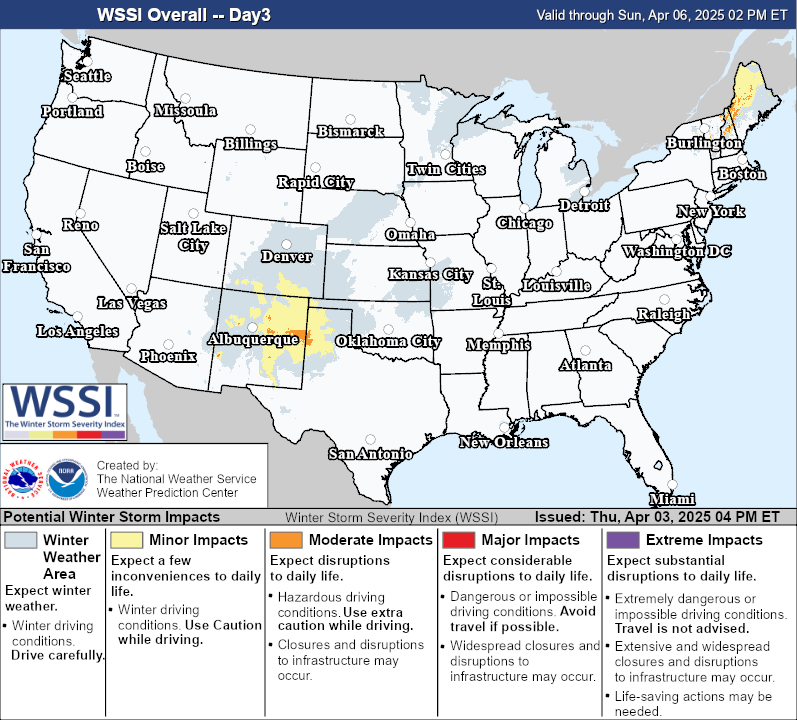
Winter Storm Severity
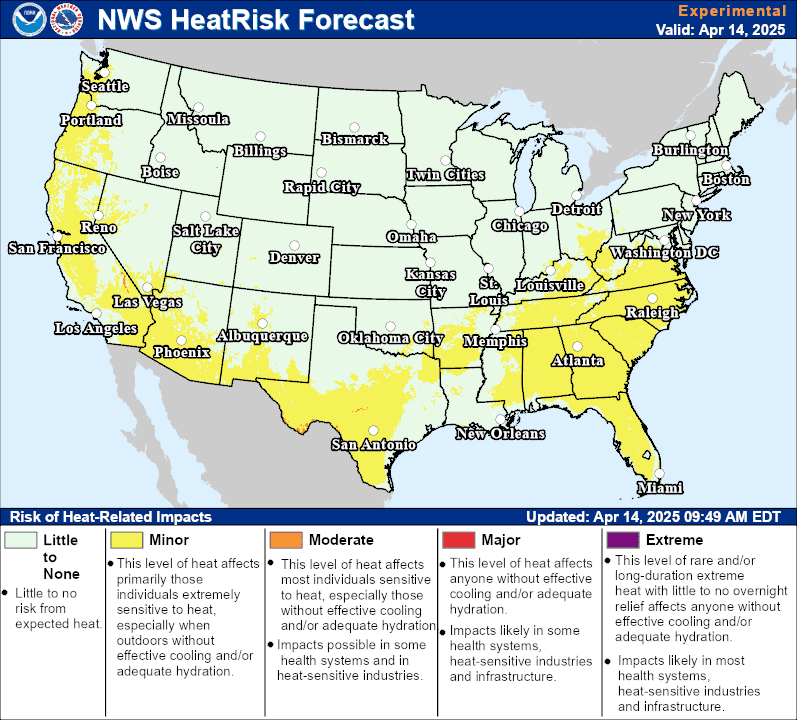
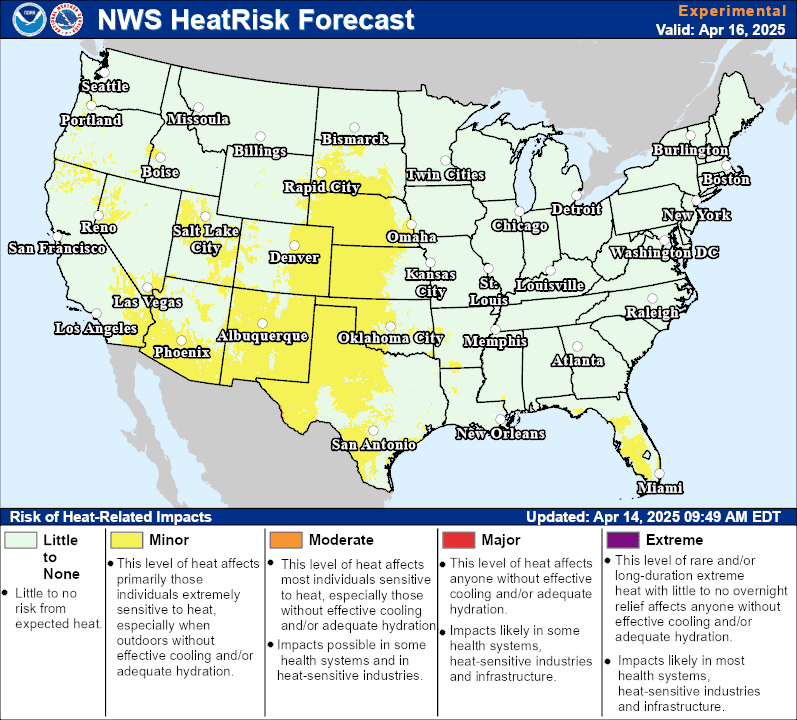
Heat Risk
High Temperature

Low Temperature

Tomorrow
National Forecast

Severe Thunderstorms

Hail Probability

Wind Probability

Tornado Probability

Wind Gusts

Wildfire Risk

Flash Floods

Precipitation Amounts

Snowfall amounts

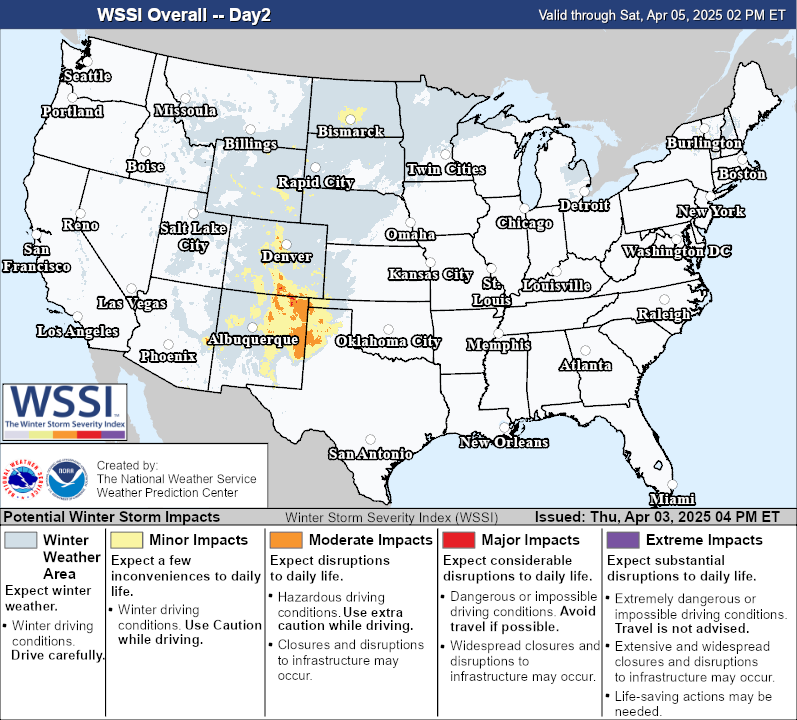
Winter Storm Severity
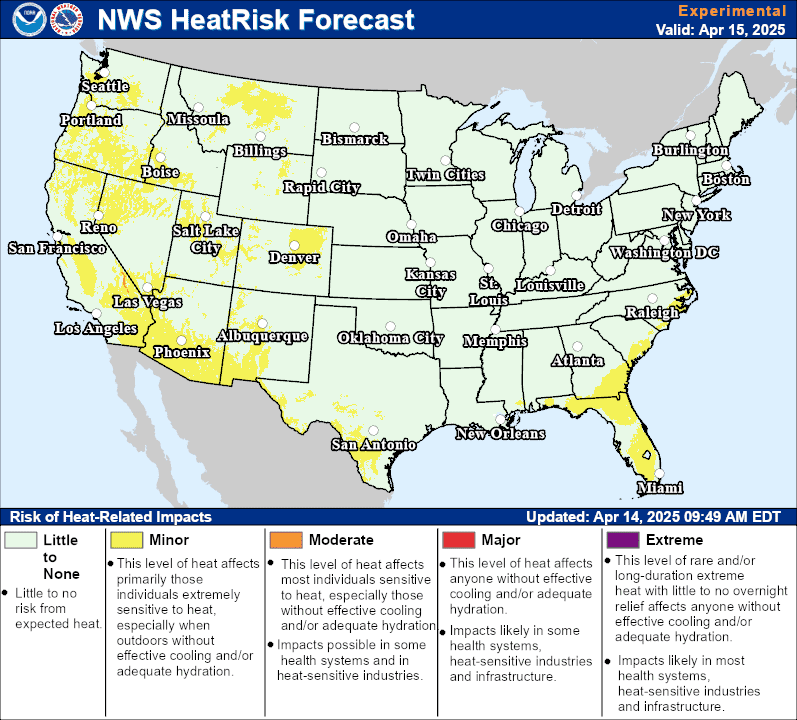
Heat Risk
High Temperature

Low Temperature

The Next Day
National Forecast

Severe Thunderstorms

Hail Probability not provided for Day 3
Wind Probability not provided for Day 3
Tor Probability not provided for Day 3
Wind Gusts

Wildfire Risk

Flash Floods

Precipitation Amounts

Snowfall amounts

Winter Storm Severity
Heat Risk
High Temperature

Low Temperature


Follow Us: